Full review against live Prometheus, with surgical fixes.
Before
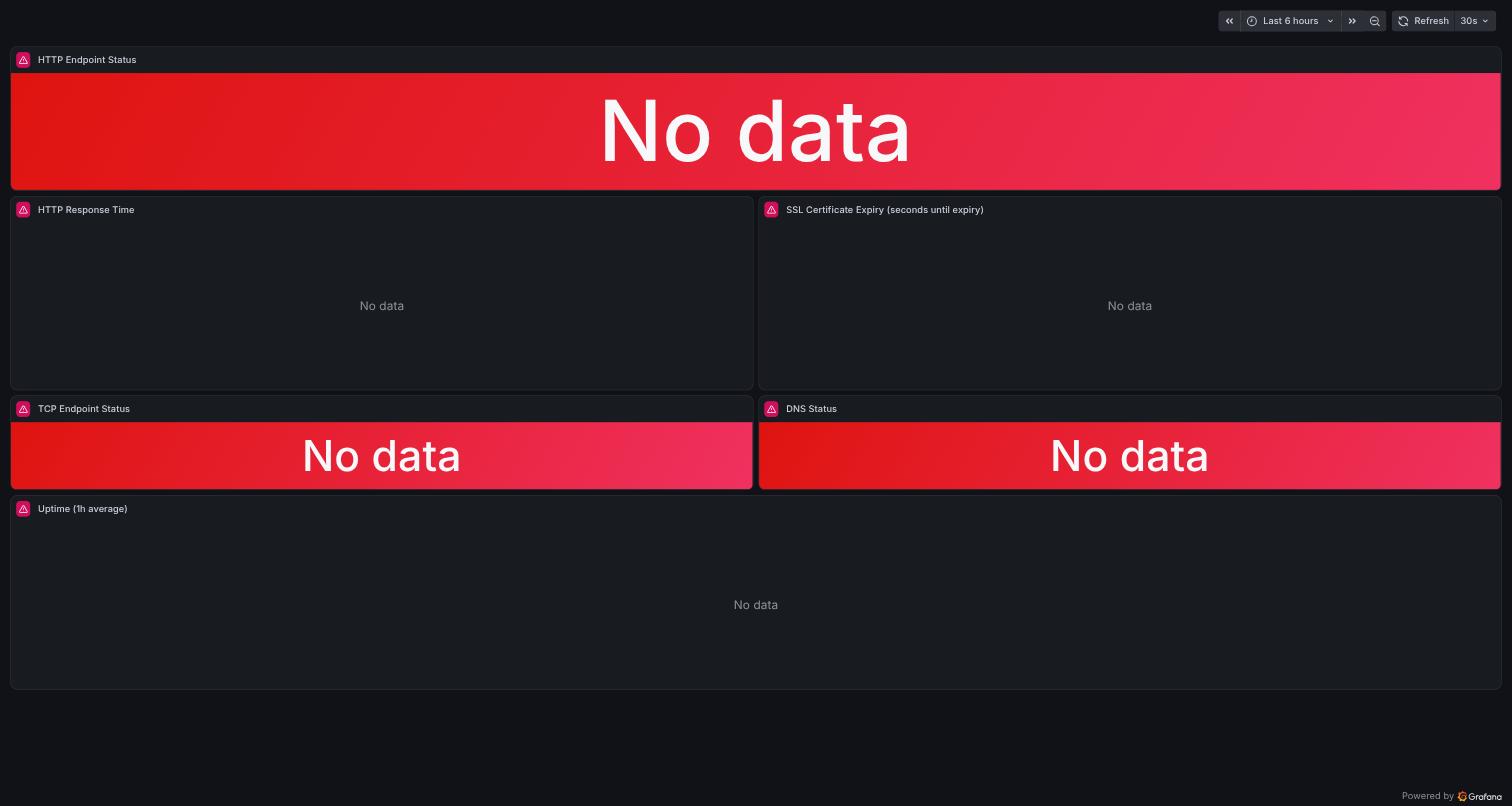
All panels dead — "No data" + datasource errors:
After
Review report
The dashboard was 100% dead — every panel rendered "No data" with a datasource error triangle.
Critical
All 6 panels referenced the retired prometheus-legacy datasource. dashboards/kustomization.yaml documents that this datasource (LXC 227) was retired 2026-05-09 and dashboards were supposed to be repointed — this one was missed. ✅ FIXED — repointed all panels to prometheus. (Heads-up: gitea-overview.json and alloy-overview.json still reference prometheus-legacy too — same bug, outside this PR's scope.)
"TCP Endpoint Status" queried probe_success{job="blackbox-tcp"} — the job no longer exists. monitoring-rules/probes-blackbox.yaml records the blackbox-tcp Probe was deliberately deleted 2026-05-20 (only target was the decommissioned postgres-ha VIP). ✅ FIXED — panel removed. Re-add a Probe + panel together if a new TCP target ever appears.
"DNS Status" queried probe_success{job="blackbox-dns"} — this job has never existed in this Prometheus.
The similarly-named dns-servers job is Alloy on the proxmox-dns VMs (node metrics, not probes). count by (job)(probe_success) returns only blackbox-http. ✅ FIXED — panel removed.
Major
SSL cert expiry shown as a seconds-countdown timeseries.
The - time() math was actually correct (no raw-timestamp bug here), but a linearly decreasing line with unit s is poor signal — what matters is the current remaining time per cert. ✅ FIXED — converted to a days-remaining bar gauge: instant query (probe_ssl_earliest_cert_expiry - time()) / 86400, red <7 d, orange <30 d, green ≥30 d, max 90 d (Let's Encrypt cycle). Current state: all certs 77–82 days out.
Minor
Status stat panels used range queries + lastNotNull. A removed/dead probe target would keep showing its last-known UP indefinitely. ✅ FIXED — instant: true on all current-value stat queries; a vanished target now honestly disappears instead of showing stale green.
Freed row repurposed as "HTTP Status Codes". New stat panel on probe_http_status_code (2xx green, 3xx orange, 4xx+ red, code 0 mapped to FAIL). Currently all 10 targets return 200.
Uptime panel axis/fill. ✅ FIXED — y-axis pinned to 0–100 % and fill removed (10 overlapping filled series at 100 % rendered as a muddy brown block).
Real-world findings (not papered over)
All 10 HTTP probe targets are UP, all return 200, probe durations 4–184 ms (the ~160 ms ones are the Authentik-gated externals — expected, the probe follows the gate redirect).
No genuinely down targets to report.
Verification (live Prometheus via port-forward)
count by (job)(probe_success) → only blackbox-http (10 series). Confirms findings 2 & 3.
probe_success{job="blackbox-http"} → 10 targets, all 1; labels are instance/job/namespace only.
Cross-checked the claim that the host label lives on blackbox-probe metrics: it does not — host exists only on coredns / authentik-outpost / loki_write / kube_ingress_path / rest_client metrics. Irrelevant here (this dashboard has no template variables), but noted for the record.
(probe_ssl_earliest_cert_expiry - time())/86400 → 8 HTTPS targets, 77–82 days. The two in-cluster http://.../-/healthy probes correctly have no SSL series and don't appear in the gauge.
probe_http_status_code → all 200. probe_duration_seconds → 4–184 ms.
JSON validated; AFTER screenshot rendered via temp preview uid blackbox-overview-preview (deleted afterwards).
# Dashboard review: blackbox-overview ("Blackbox Exporter - Endpoint Probes")
Full review against live Prometheus, with surgical fixes.
## Before
All panels dead — "No data" + datasource errors:

## After

## Review report
The dashboard was **100% dead** — every panel rendered "No data" with a datasource error triangle.
### Critical
1. **All 6 panels referenced the retired `prometheus-legacy` datasource.**
`dashboards/kustomization.yaml` documents that this datasource (LXC 227) was retired 2026-05-09 and dashboards were supposed to be repointed — this one was missed.
✅ FIXED — repointed all panels to `prometheus`. (Heads-up: `gitea-overview.json` and `alloy-overview.json` still reference `prometheus-legacy` too — same bug, outside this PR's scope.)
2. **"TCP Endpoint Status" queried `probe_success{job="blackbox-tcp"}` — the job no longer exists.**
`monitoring-rules/probes-blackbox.yaml` records the blackbox-tcp Probe was deliberately deleted 2026-05-20 (only target was the decommissioned postgres-ha VIP).
✅ FIXED — panel removed. Re-add a Probe + panel together if a new TCP target ever appears.
3. **"DNS Status" queried `probe_success{job="blackbox-dns"}` — this job has never existed in this Prometheus.**
The similarly-named `dns-servers` job is Alloy on the proxmox-dns VMs (node metrics, not probes). `count by (job)(probe_success)` returns only `blackbox-http`.
✅ FIXED — panel removed.
### Major
4. **SSL cert expiry shown as a seconds-countdown timeseries.**
The `- time()` math was actually correct (no raw-timestamp bug here), but a linearly decreasing line with unit `s` is poor signal — what matters is the current remaining time per cert.
✅ FIXED — converted to a days-remaining bar gauge: instant query `(probe_ssl_earliest_cert_expiry - time()) / 86400`, red <7 d, orange <30 d, green ≥30 d, max 90 d (Let's Encrypt cycle). Current state: all certs 77–82 days out.
### Minor
5. **Status stat panels used range queries + lastNotNull.** A removed/dead probe target would keep showing its last-known UP indefinitely.
✅ FIXED — `instant: true` on all current-value stat queries; a vanished target now honestly disappears instead of showing stale green.
6. **Freed row repurposed as "HTTP Status Codes".** New stat panel on `probe_http_status_code` (2xx green, 3xx orange, 4xx+ red, code 0 mapped to FAIL). Currently all 10 targets return 200.
7. **Uptime panel axis/fill.**
✅ FIXED — y-axis pinned to 0–100 % and fill removed (10 overlapping filled series at 100 % rendered as a muddy brown block).
## Real-world findings (not papered over)
- All 10 HTTP probe targets are UP, all return 200, probe durations 4–184 ms (the ~160 ms ones are the Authentik-gated externals — expected, the probe follows the gate redirect).
- No genuinely down targets to report.
## Verification (live Prometheus via port-forward)
- `count by (job)(probe_success)` → only `blackbox-http` (10 series). Confirms findings 2 & 3.
- `probe_success{job="blackbox-http"}` → 10 targets, all `1`; labels are `instance`/`job`/`namespace` only.
- Cross-checked the claim that the `host` label lives on blackbox-probe metrics: **it does not** — `host` exists only on coredns / authentik-outpost / loki_write / kube_ingress_path / rest_client metrics. Irrelevant here (this dashboard has no template variables), but noted for the record.
- `(probe_ssl_earliest_cert_expiry - time())/86400` → 8 HTTPS targets, 77–82 days. The two in-cluster `http://.../-/healthy` probes correctly have no SSL series and don't appear in the gauge.
- `probe_http_status_code` → all 200. `probe_duration_seconds` → 4–184 ms.
- JSON validated; AFTER screenshot rendered via temp preview uid `blackbox-overview-preview` (deleted afterwards).
The dashboard was 100% dead: every panel still referenced the
prometheus-legacy datasource retired on 2026-05-09, so all panels
rendered 'No data' with datasource errors.
- Repoint all panels prometheus-legacy -> prometheus
- Remove TCP Endpoint Status panel: the blackbox-tcp Probe was
deliberately deleted 2026-05-20 (see probes-blackbox.yaml), the job
no longer exists
- Remove DNS Status panel: no blackbox-dns job has ever existed in
this Prometheus (the dns-servers job is Alloy on the DNS VMs, not a
probe)
- Replace the freed row with HTTP Status Codes (probe_http_status_code,
instant, 2xx green / 3xx orange / 4xx+ and probe-fail red)
- Convert SSL Certificate Expiry from a seconds-countdown timeseries to
a days-remaining bar gauge (instant, red <7d, orange <30d, green)
- Make status stat queries instant so dead probes render No data
instead of a stale last-known value
- Pin Uptime y-axis to 0-100% and drop the fill (10 overlapping series
at 100% rendered as a muddy block)
Co-Authored-By: Claude Opus 4.8 <noreply@anthropic.com>
Blocking a user prevents them from interacting with repositories, such as opening or commenting on pull requests or issues. Learn more about blocking a user.
Dashboard review: blackbox-overview ("Blackbox Exporter - Endpoint Probes")
Full review against live Prometheus, with surgical fixes.
Before
All panels dead — "No data" + datasource errors:

After
Review report
The dashboard was 100% dead — every panel rendered "No data" with a datasource error triangle.
Critical
All 6 panels referenced the retired
prometheus-legacydatasource.dashboards/kustomization.yamldocuments that this datasource (LXC 227) was retired 2026-05-09 and dashboards were supposed to be repointed — this one was missed.✅ FIXED — repointed all panels to
prometheus. (Heads-up:gitea-overview.jsonandalloy-overview.jsonstill referenceprometheus-legacytoo — same bug, outside this PR's scope.)"TCP Endpoint Status" queried
probe_success{job="blackbox-tcp"}— the job no longer exists.monitoring-rules/probes-blackbox.yamlrecords the blackbox-tcp Probe was deliberately deleted 2026-05-20 (only target was the decommissioned postgres-ha VIP).✅ FIXED — panel removed. Re-add a Probe + panel together if a new TCP target ever appears.
"DNS Status" queried
probe_success{job="blackbox-dns"}— this job has never existed in this Prometheus.The similarly-named
dns-serversjob is Alloy on the proxmox-dns VMs (node metrics, not probes).count by (job)(probe_success)returns onlyblackbox-http.✅ FIXED — panel removed.
Major
The
- time()math was actually correct (no raw-timestamp bug here), but a linearly decreasing line with unitsis poor signal — what matters is the current remaining time per cert.✅ FIXED — converted to a days-remaining bar gauge: instant query
(probe_ssl_earliest_cert_expiry - time()) / 86400, red <7 d, orange <30 d, green ≥30 d, max 90 d (Let's Encrypt cycle). Current state: all certs 77–82 days out.Minor
Status stat panels used range queries + lastNotNull. A removed/dead probe target would keep showing its last-known UP indefinitely.
✅ FIXED —
instant: trueon all current-value stat queries; a vanished target now honestly disappears instead of showing stale green.Freed row repurposed as "HTTP Status Codes". New stat panel on
probe_http_status_code(2xx green, 3xx orange, 4xx+ red, code 0 mapped to FAIL). Currently all 10 targets return 200.Uptime panel axis/fill.
✅ FIXED — y-axis pinned to 0–100 % and fill removed (10 overlapping filled series at 100 % rendered as a muddy brown block).
Real-world findings (not papered over)
Verification (live Prometheus via port-forward)
count by (job)(probe_success)→ onlyblackbox-http(10 series). Confirms findings 2 & 3.probe_success{job="blackbox-http"}→ 10 targets, all1; labels areinstance/job/namespaceonly.hostlabel lives on blackbox-probe metrics: it does not —hostexists only on coredns / authentik-outpost / loki_write / kube_ingress_path / rest_client metrics. Irrelevant here (this dashboard has no template variables), but noted for the record.(probe_ssl_earliest_cert_expiry - time())/86400→ 8 HTTPS targets, 77–82 days. The two in-clusterhttp://.../-/healthyprobes correctly have no SSL series and don't appear in the gauge.probe_http_status_code→ all 200.probe_duration_seconds→ 4–184 ms.blackbox-overview-preview(deleted afterwards).