fix(authentik-overview): repair dead Status panel, dedupe stats, fix outpost panel #291

Merged
k.renner merged 1 commits from claude-bot/dash-authentik-overview into master 2026-07-17 13:16:34 +00:00
Member

Dashboard review: authentik-overview ("Authentik Overview")

Full review against live Prometheus, with surgical fixes (18 lines changed, no reformatting).

Before

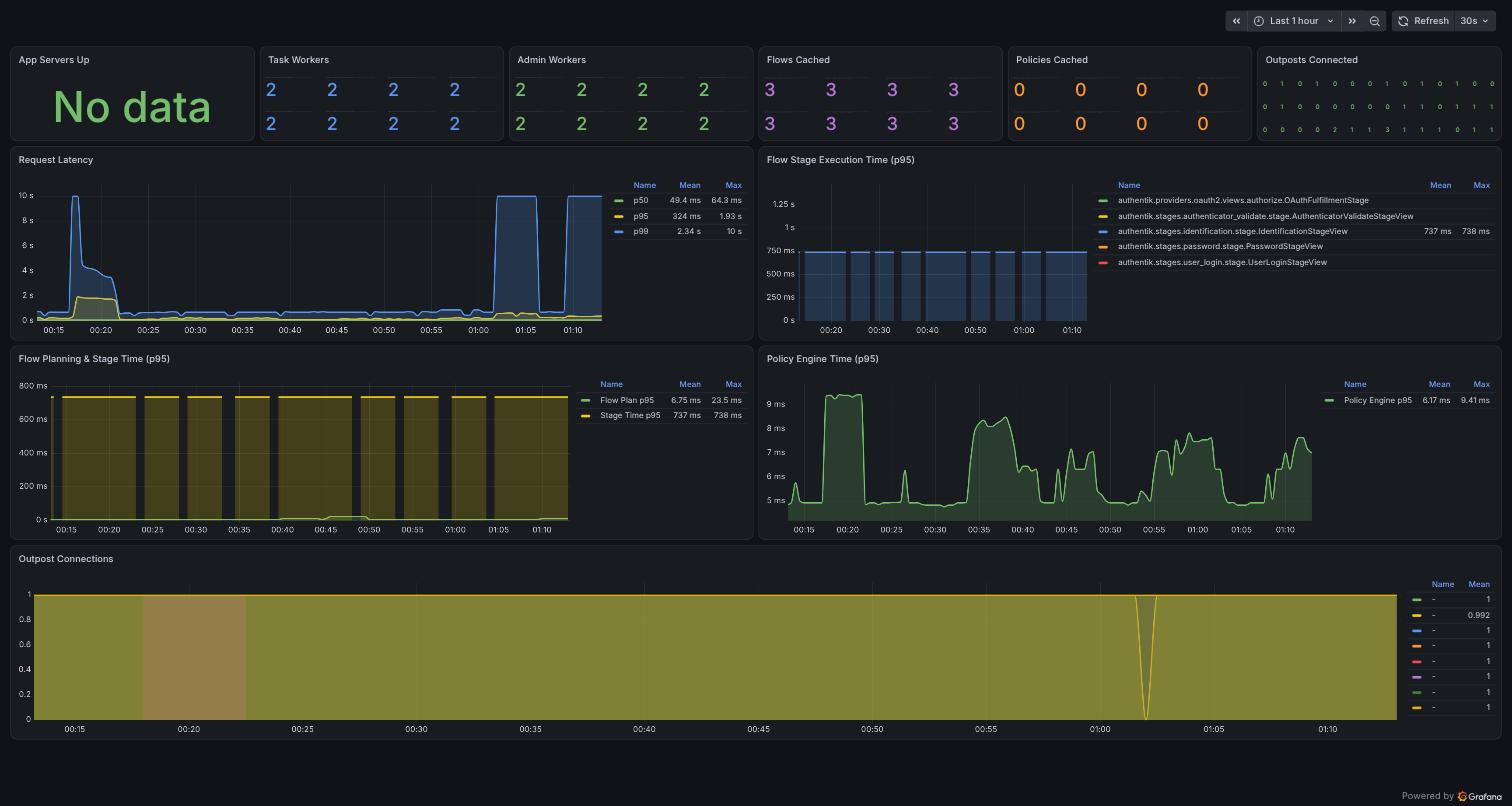
Dead "App Servers Up", 8 repeated numbers per stat, 0/1 grid in "Outposts Connected", "-" legend in "Outpost Connections":
before

After

after

Review report

Good news first: authentik metrics ARE scraped (job authentik-server-metrics, 2 server pods, plus per-outpost sidecar jobs) — no missing-ServiceMonitor problem. The four latency/timing panels (Request Latency, Flow Stage Execution, Flow Planning & Stage, Policy Engine) were verified correct and left untouched. The top stat row and the bottom outpost panel were broken.

Findings

  1. CRITICAL — "App Servers Up" was dead ("No data"). count(up{job="authentik"} == 1) — the job label authentik does not exist (verified: zero rows). The real job is authentik-server-metrics. Same defect class that killed panels on homeassistant-overview and node-metrics.
    ✅ FIXED — query uses job="authentik-server-metrics" (returns 2), plus or vector(0) and a red base threshold so a dead scrape renders a red 0 instead of "No data".

  2. MAJOR — Task Workers / Admin Workers / Flows Cached / Policies Cached each rendered 8 repeated numbers. The raw gauges return 4 series per metric (2 server pods × 2 gunicorn pids, each exporting the same global value). A stat panel without aggregation shows every series.
    ✅ FIXED — wrapped each in max(...) (verified lossless: all series carry identical values, e.g. max(authentik_tasks_workers) = 2). Worker stats got a red-below-1 threshold.

  3. MAJOR — "Outposts Connected" was an unreadable, misleading grid of ~30 tiny 0/1 values. authentik_outposts_connected is per-outpost × per-pod × per-pid; a WebSocket lands on ONE server process, so the other pids legitimately report 0 for the same outpost. The panel displayed those 0s as if outposts were down — in reality all 10 outposts are connected.
    ✅ FIXED — count(max by (outpost) (authentik_outposts_connected) > 0) or vector(0) → shows 10, red threshold below 1.

  4. MAJOR — "Outpost Connections" legend showed only "-" for every series. legendFormat: {{name}} - {{uid}} uses labels that don't exist on authentik_outpost_connection (real labels: outpost_name, outpost_type, uuid). That outpost-side metric also only covers the 4 outposts whose sidecars are scraped (LDAP, paperless-gate, Embedded, Local Radius) — the other 6 proxy outposts (vscode-gate, shelly-manager-gate, prometheus-gate, alertmanager-gate, esphome-gate, zone-configurator-gate) were invisible. The LDAP outpost is additionally scraped by two jobs (ak-outpost-ldap-outpost + ak-outpost-ldap-outpost-metrics), producing duplicate overlapping series.
    ✅ FIXED — replaced with the server-side view max by (outpost) (authentik_outposts_connected) rendered as a state-timeline: one row per outpost, green = connected, value 0 mapped red "getrennt". Covers all 10 outposts and is immune to the double scrape.

  5. MINOR — stats used range queries + lastNotNull, so a dead exporter would keep showing its last value as if live.
    ✅ FIXED — all 6 stat targets switched to "instant": true.

  6. NOT A BUG — p99 Request Latency plateaus at 10 s. Long-polling/streaming requests hitting the top histogram bucket; real traffic behavior, left as-is.

Open questions / notes

  • ❓ Source-side, not fixed here: the LDAP outpost pod is scraped twice (ak-outpost-ldap-outpost AND ak-outpost-ldap-outpost-metrics target the same endpoint). Dashboard-side it's neutralized via max by, but you may want to drop one of the two Services/ServiceMonitors.
  • authentik_enterprise_license_expiry_seconds exists if you ever want a license-expiry stat; not added since this looks like an OSS install.

Verification

All queries were run against live Prometheus (port-forward, instant queries) before being written:

Query Result
up{job="authentik"} 0 rows (root cause, finding 1)
count(up{job="authentik-server-metrics"} == 1) 2
max(authentik_tasks_workers) / max(authentik_admin_workers) 2 / 2
max(authentik_flows_cached) / max(authentik_policies_cached) 3 / 0
count(max by (outpost) (authentik_outposts_connected) > 0) or vector(0) 10 (of 10 outposts, all connected)
max by (outpost) (authentik_outposts_connected) exactly 10 series, one per outpost
labels on authentik_outpost_connection outpost_name/outpost_type/uuid — name/uid don't exist (finding 4)
histogram rates (authentik_main_request_duration_seconds, authentik_flows_*, authentik_policies_engine_time_total_seconds) all return data; panels confirmed working in the render

JSON validated; AFTER screenshot rendered via temp preview uid authentik-overview-preview (deleted afterwards).

# Dashboard review: authentik-overview ("Authentik Overview") Full review against live Prometheus, with surgical fixes (18 lines changed, no reformatting). ## Before Dead "App Servers Up", 8 repeated numbers per stat, 0/1 grid in "Outposts Connected", "-" legend in "Outpost Connections": ![before](https://gitea.renner.uno/attachments/8c32cb1b-38e1-430b-8499-edcce8943779) ## After ![after](https://gitea.renner.uno/attachments/28212cdc-3f58-494e-ada8-9834ac806b76) ## Review report Good news first: authentik metrics ARE scraped (job `authentik-server-metrics`, 2 server pods, plus per-outpost sidecar jobs) — no missing-ServiceMonitor problem. The four latency/timing panels (Request Latency, Flow Stage Execution, Flow Planning & Stage, Policy Engine) were verified correct and left untouched. The top stat row and the bottom outpost panel were broken. ### Findings 1. **CRITICAL — "App Servers Up" was dead ("No data").** `count(up{job="authentik"} == 1)` — the job label `authentik` does not exist (verified: zero rows). The real job is `authentik-server-metrics`. Same defect class that killed panels on homeassistant-overview and node-metrics. ✅ FIXED — query uses `job="authentik-server-metrics"` (returns 2), plus `or vector(0)` and a red base threshold so a dead scrape renders a red **0** instead of "No data". 2. **MAJOR — Task Workers / Admin Workers / Flows Cached / Policies Cached each rendered 8 repeated numbers.** The raw gauges return 4 series per metric (2 server pods × 2 gunicorn pids, each exporting the same global value). A stat panel without aggregation shows every series. ✅ FIXED — wrapped each in `max(...)` (verified lossless: all series carry identical values, e.g. `max(authentik_tasks_workers)` = 2). Worker stats got a red-below-1 threshold. 3. **MAJOR — "Outposts Connected" was an unreadable, misleading grid of ~30 tiny 0/1 values.** `authentik_outposts_connected` is per-outpost × per-pod × per-pid; a WebSocket lands on ONE server process, so the other pids legitimately report 0 for the same outpost. The panel displayed those 0s as if outposts were down — in reality **all 10 outposts are connected**. ✅ FIXED — `count(max by (outpost) (authentik_outposts_connected) > 0) or vector(0)` → shows **10**, red threshold below 1. 4. **MAJOR — "Outpost Connections" legend showed only "-" for every series.** `legendFormat: {{name}} - {{uid}}` uses labels that don't exist on `authentik_outpost_connection` (real labels: `outpost_name`, `outpost_type`, `uuid`). That outpost-side metric also only covers the 4 outposts whose sidecars are scraped (LDAP, paperless-gate, Embedded, Local Radius) — the other 6 proxy outposts (vscode-gate, shelly-manager-gate, prometheus-gate, alertmanager-gate, esphome-gate, zone-configurator-gate) were invisible. The LDAP outpost is additionally scraped by two jobs (`ak-outpost-ldap-outpost` + `ak-outpost-ldap-outpost-metrics`), producing duplicate overlapping series. ✅ FIXED — replaced with the server-side view `max by (outpost) (authentik_outposts_connected)` rendered as a **state-timeline**: one row per outpost, green = connected, value 0 mapped red "getrennt". Covers all 10 outposts and is immune to the double scrape. 5. **MINOR — stats used range queries + lastNotNull**, so a dead exporter would keep showing its last value as if live. ✅ FIXED — all 6 stat targets switched to `"instant": true`. 6. **NOT A BUG — p99 Request Latency plateaus at 10 s.** Long-polling/streaming requests hitting the top histogram bucket; real traffic behavior, left as-is. ### Open questions / notes - ❓ **Source-side, not fixed here:** the LDAP outpost pod is scraped twice (`ak-outpost-ldap-outpost` AND `ak-outpost-ldap-outpost-metrics` target the same endpoint). Dashboard-side it's neutralized via `max by`, but you may want to drop one of the two Services/ServiceMonitors. - `authentik_enterprise_license_expiry_seconds` exists if you ever want a license-expiry stat; not added since this looks like an OSS install. ## Verification All queries were run against live Prometheus (port-forward, instant queries) before being written: | Query | Result | |---|---| | `up{job="authentik"}` | **0 rows** (root cause, finding 1) | | `count(up{job="authentik-server-metrics"} == 1)` | 2 | | `max(authentik_tasks_workers)` / `max(authentik_admin_workers)` | 2 / 2 | | `max(authentik_flows_cached)` / `max(authentik_policies_cached)` | 3 / 0 | | `count(max by (outpost) (authentik_outposts_connected) > 0) or vector(0)` | 10 (of 10 outposts, all connected) | | `max by (outpost) (authentik_outposts_connected)` | exactly 10 series, one per outpost | | labels on `authentik_outpost_connection` | `outpost_name`/`outpost_type`/`uuid` — `name`/`uid` don't exist (finding 4) | | histogram rates (`authentik_main_request_duration_seconds`, `authentik_flows_*`, `authentik_policies_engine_time_total_seconds`) | all return data; panels confirmed working in the render | JSON validated; AFTER screenshot rendered via temp preview uid `authentik-overview-preview` (deleted afterwards).
claude-bot added 1 commit 2026-07-16 23:22:52 +00:00
- App Servers Up: job="authentik" matches nothing (real job label is
  authentik-server-metrics) -> panel showed 'No data'. Also 'or vector(0)'
  + red threshold so a dead scrape shows a red 0 instead of No data.
- Task/Admin Workers, Flows/Policies Cached: raw gauges return 4 series
  (2 pods x 2 pids) -> stats rendered 8 repeated numbers. Wrapped in max().
- Outposts Connected: raw per-outpost/per-pid series rendered an unreadable
  grid of ~30 0/1 values (0s were per-process views, not real disconnects).
  Now counts outposts with >=1 active WebSocket connection (10/10).
- Outpost Connections: legendFormat used non-existent labels {{name}}/{{uid}}
  (real: outpost_name/uuid) -> every legend row was '-'. Replaced with
  server-side authentik_outposts_connected as a state-timeline, one row per
  outpost, red mapping for 'getrennt'; covers all 10 outposts instead of the
  4 with scraped sidecar metrics.
- All stat queries switched to instant so dead sensors render honestly.

Co-Authored-By: Claude Opus 4.8 <noreply@anthropic.com>
k.renner merged commit 0225dabe0e into master 2026-07-17 13:16:34 +00:00
Sign in to join this conversation.